It turns out that the blogpost I wrote 10 years ago about getting data from Statistics Denmark into Power BI with Power Query still is being used – 😊 – link.
But as the API has changed a bit since then I was asked to do an update of the blogpost – so here is how you can get the population of Denmark imported into Power BI with Power Query.
The source
Statistics Denmark provides you with a lot of information about Denmark. These data can be accessed via this site – Statistics Denmark (dst.dk). When you manually want to download the data you will find all the tables in Statistikbanken (statbank.dk) – which provides an interface to setup a report that you then will be able to download in different formats.

In this example, I set up a simple report and you can see the export formats here.

As a Power BI developer we don’t want to do this – we want to automatically retrieve new data – API to the rescue
The Statistics Denmark does provide an API that we can use to extract the data automatically.
Its located here – Databank API – Statistics Denmark (dst.dk)

Let’s extract the Population for Denmark
When we click the button “START CONSOLE” we get this

We want to retrieve data so pick that under 1) Choose API call

Under 2) Choose settings for call we first need to select whether to do a get or a post call – we can do both but a post call requires a bit more manual code so I will stick to a get call. (If you want to know how to create a post call in Power Query – I can recommend this article from Chris Webb – Chris Webb’s BI Blog: Web Services And POST Requests In Power Query (crossjoin.co.uk) or my own here – Specifying JSON Query in Power Query – Example Statistics Sweden – Erik Svensen – Blog about Power BI, Power Apps, Power Query (wordpress.com).
Next is to specify the table name

In the Table id I have specified “Folk1a” – you can find the different table names in Statbank (id highlighted in green)

Next – select the Format “CSV” as this is the binary format the API will return to Power Query.

When you click more settings, you can change the delimiter if needed.

Next up we will click the Variable- and value codes and this will give us the opportunity to select what data we want to extract from the source.


You can click the individual items/codes or click on the * to get all elements from the variable.
In this example I have picked all KØN (gender), all ALDER (ages), total for CIVILSTAND (marital status), All – TID (time) and all OMRÅDE (regions and municipalities)
Under Other settings I leave it to default but you could change the language to English for instance

Under 3) Call the API with the chosen settings

You can see that a URL with the query is created for you.
You can then click Execute to see the result

OOPS – the API is limited to 1.000.000 cells
So, it’s telling me to extract the data either by using BULK or another streaming format instead.
Go back to 2) Choose setting for call

And select BULK under Streaming.
The URL under 3) will now be changed

And you could try and execute the query once again and the result will be shown after a while.
Copy the URL …. And then
Let’s do it in Power Query
Open Power BI Desktop and click get data and choose Web

Paste the URL into the dialog box and click OK

Very quickly you will get this based on the first 200 rows

If the Query is what you want, then click Load but you should really click Transform Data to control what data is imported to your model – so click Transform Data
And wait a couple of seconds for the preview data to load.
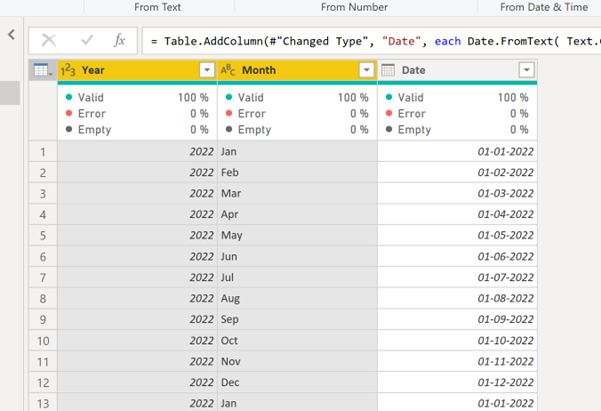
The data contains total lines, text after ages, not a proper date for the time and a few other transformations before we are ready to import the data in to our data model.
I won’t go through each of them but have a look at the file.
You can modify the URL to change what time is imported and make it dynamic depending on what you want imported instead of just all periods.
The API is not the fastest so the appx. 1.2 million rows this selection returns takes a couple of minutes to update.
And then we can start to create explicit DAX measures and visualize our data.
In the demo file I have created this page to create an overview of the change in the population between two different periods in top x municipalities in Denmark.

You can download the demo file here – and just click refresh to get the latest data 😊
Let me know what you think and if you like it give the post a like please.
Stay Queryious !!!