
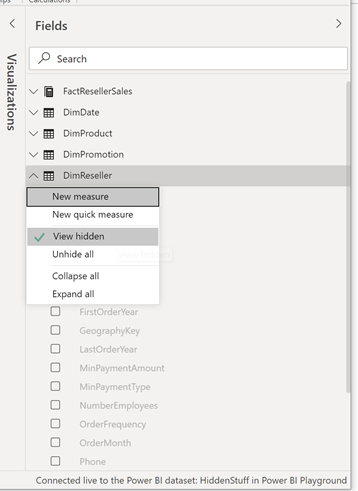
When you connect to a Power BI Dataset from Power BI desktop you might have noticed that you can see and use hidden measures and columns in the dataset.

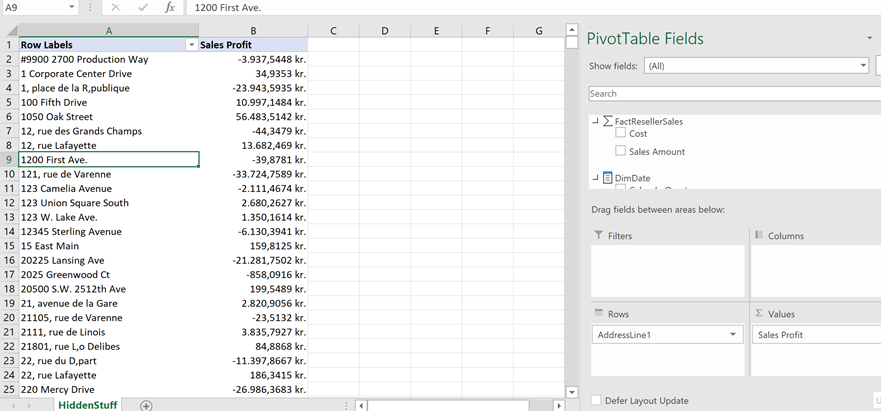
But the hidden fields cannot be seen if you browse the dataset in Excel.

But that does not mean that you cannot use the fields in Excel – and here is how you can do it.
Using VBA
You can use VBA by creating a macro
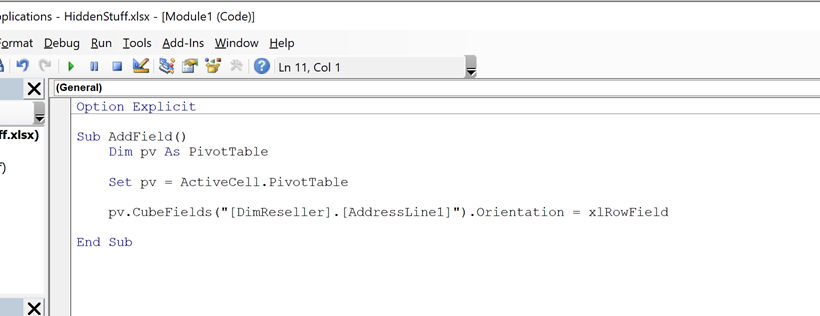
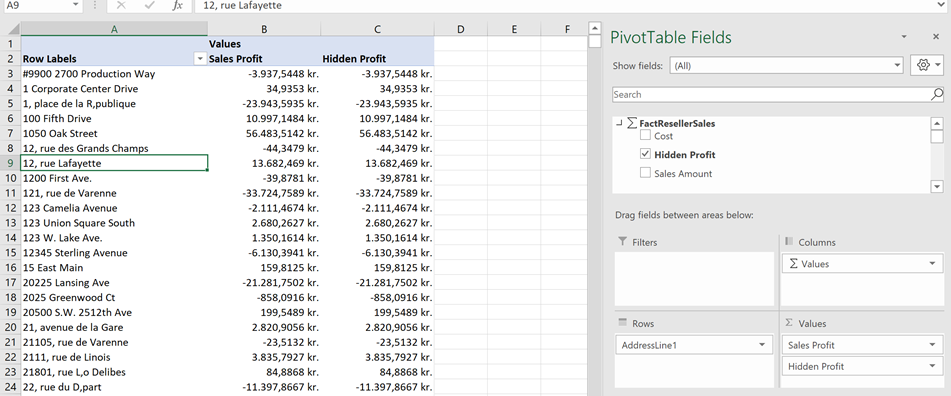
The code will add the field AddressLine1 from the DImReseller dimension as a Rowfield if the active cell contains a pivotable.
Sub AddField()
    Dim pv As PivotTable
        Set pv = ActiveCell.PivotTable
        pv.CubeFields("[DimReseller].[AddressLine1]").Orientation = xlRowField
End Sub
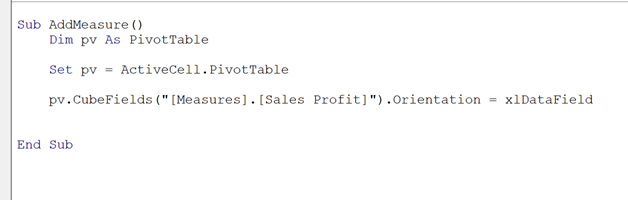
If you want to add a measure/value to the pivotable you need to set change the Orientation property to xlDataFields
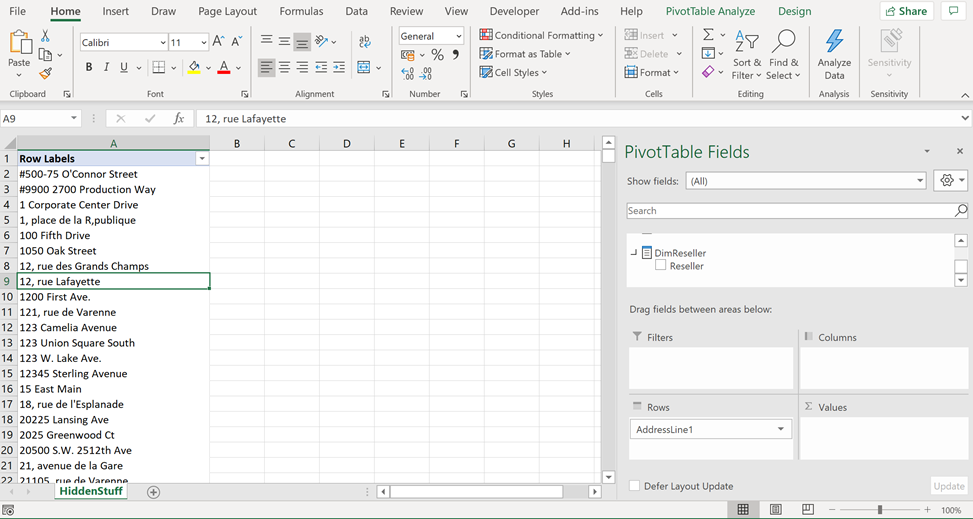
This means that we now have added two hidden fields from the dataset
Add hidden measures using OLAP Tools
You can also add hidden measures using the OLAP Tools and MDX Calculated Measure
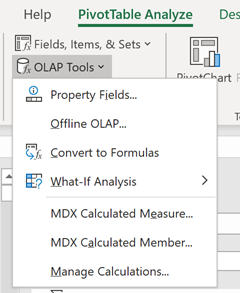
Simply create a new calculated measure by referencing the hidden measure in the MDX
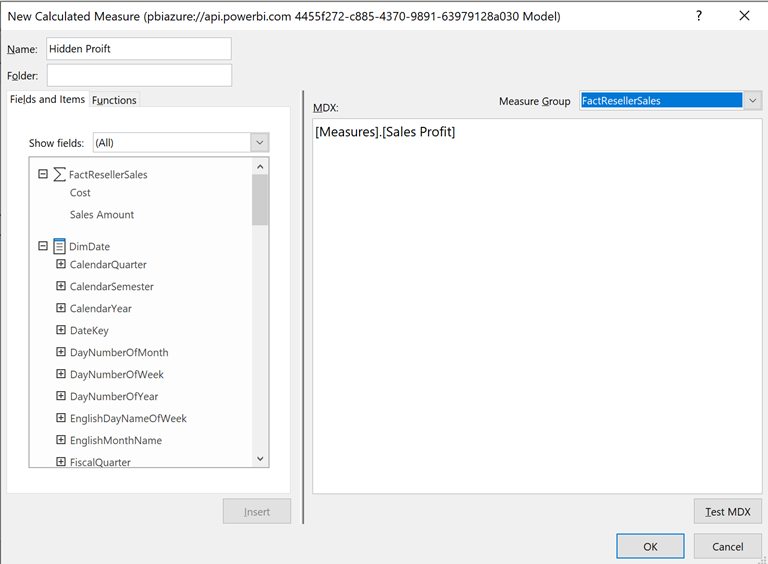
This will add a calculated Measure to the measure group you selected
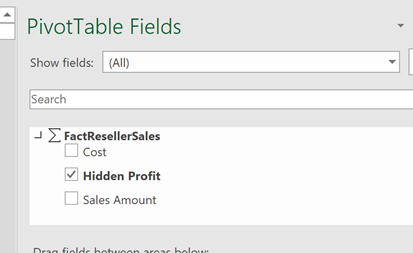
And you can add that to your pivotable
Referencing hidden items using CUBE functions
Notice that you can also reference the hidden measures using CUBE functions
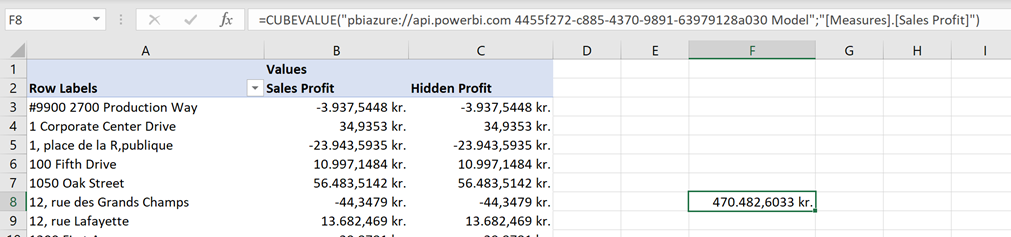
Simply specify the name of the measure as the member expression in this case as “[Measures].[Sales Profit]”
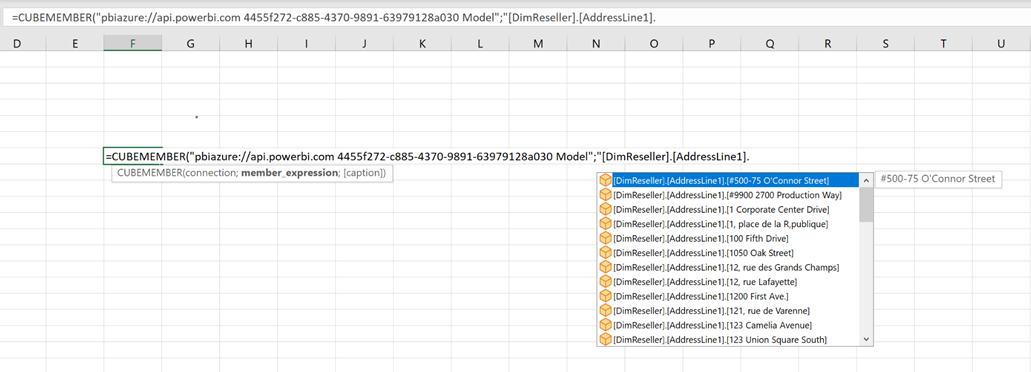
You can also refer to members from hidden fields using the CUBEMEMBER functions
Hope this can help you too.
Power On!

Thanks for this useful content.
Is it possible to use hidden measures from Power BI dataset in paginated report?
Glad you find it useful – if you don’t use object level security then yes it is possible- you might have to create the DAX query manually