
Yesterday I tweeted about how I solved the implementation of a Many 2 Many filter using Calculation groups.

And was encouraged to write a blog post about this – so here it is 😊.
The scenario
Imagine a simple star schema where we have a fact table with sales and a customer and Date dimension.

And a in the demo I have also created a few measures – (in my actual customer case I had over 100 measures)

Now we want to expand the model to handle that a customer can belong to one or more customer groups –

This is done by adding the table Customer Groups that contains the Customer Groups and then a bridge table that contains the link between the customers to the different customers groups.
For instance, Customer Key 12031 both belongs to Customer Group 1 and 2.

But when we try to report on the Sales Value the value for the groups will be identical

This is because row context comes from the table Customer Groups and because the filter from that table can’t be passed to the customer table as the cross filter direction points the other way (red circle)

We could change the cross filter direction to Both via the Edit relationship dialog

And it would solve the problem.

But as Alberto Ferrari highlights in this blog post – Bidirectional relationships and ambiguity in DAX – SQLBI – this can be dangerous.
Change all the measures
For all our measures to work I would have to update them all and add a CROSSFILTER statement each of the measure statement

This will give me the result I want but also some work to update all measures.
Use Calculation groups to add filter to all your measures
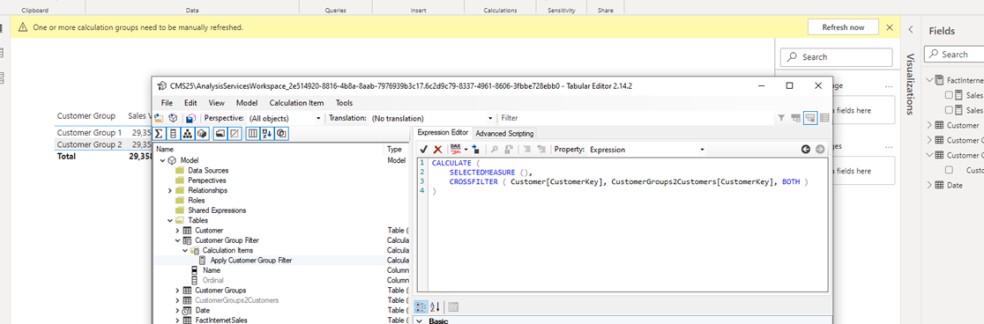
Instead let’s create a Calculation Group to apply the filter – and the tool to do this is the Tabular Editor – Tabular Editor

We will add a Calculation Group via Tables

And add a group called “Customer Group Filter”

Next step is to add a Calculation Item

I will call it “Apply Customer Group Filter”

And then in the expression editor I will add the expression that applies the CROSSFILTER to the SELECTEDMEASURE().

Clicking Save and returning to Power BI Desktop will prompt me to refresh the calculation groups
Now I will have a Calculation Group Filter in my Fields list

And we can add a slicer or a filter to the visual, page or all pages

And if we select the Calculation Item we can see the filter is being applied.

You can download the demo file – here
Summary
Typically, the calculation groups examples are normally focused on Time intelligence but absolutely not limited to time – I hope this example can give you some inspiration to use Calculation Groups in other scenarios as well.
In my actual case I saved time on updating over 100 measures – so I really ❤ calculation groups.
Let me know what you think and if you find it useful as well.
